In the dynamic world of Agile, Key Performance Indicators (KPIs) play a crucial role in measuring performance, pinpointing challenges, and driving continuous improvement. For Scrum Masters, mastering these KPIs is key to boosting team efficiency and project success.
This article unveils the Top 5 essential Agile KPIs every Scrum team must monitor. We’ll delve into each KPI, offering insights from my experience as a Scrum Master on the significance of these indicators and their practical application in Jira.

Overview of KPI:
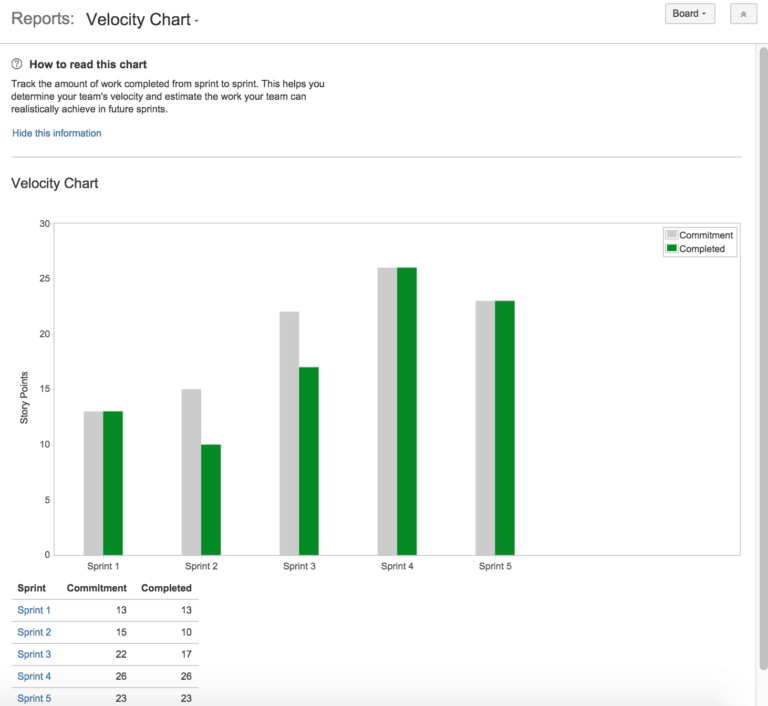
Velocity is a pivotal Agile KPI that measures the amount of work a Scrum team completes during a sprint, quantified in Story Points. This metric reflects the complexity and effort required for each work item, providing a reliable gauge of the team’s capacity. By tracking Velocity across sprints, teams gain valuable insights into their consistent work rate, enabling more accurate future sprint planning.
Personal Insights:
In my role as a Scrum Master, I’ve found Velocity to be an indispensable metric for evaluating team performance and for setting achievable goals for upcoming sprints. It’s essential, however, to use Velocity as a gauge for improvement rather than as a means of applying pressure or making comparisons between team members.
Implementation in Jira:
Jira’s “Reports” section includes a Velocity graph. To leverage this feature effectively, ensure all tasks within sprints are assigned Story Points, as these are crucial for Velocity calculations.
2. Predictability
Overview of KPI:
Predictability measures the percentage of planned tasks that were completed during the sprint. This KPI is indicative of the team’s reliability in fulfilling its commitments, offering insights into the accuracy of sprint planning and task allocation. High predictability rates are synonymous with reliability and efficiency within the team, highlighting a well-understood and manageable workload.
Personal Insights:
Predictability has proven to be a vital metric in my toolkit, especially for evaluating the precision of our sprint forecasts. A diminishing predictability rate often signals the necessity for refining our estimation processes and enhancing our approach to task management and allocation.
Implementation in Jira:
Predictability can be calculated by comparing the number of completed tasks against the total planned tasks for the sprint. In Jira, this comparison is facilitated by the “Sprint Report,” allowing for an easy assessment of sprint predictability.
3. Burndown Chart
Overview of KPI:
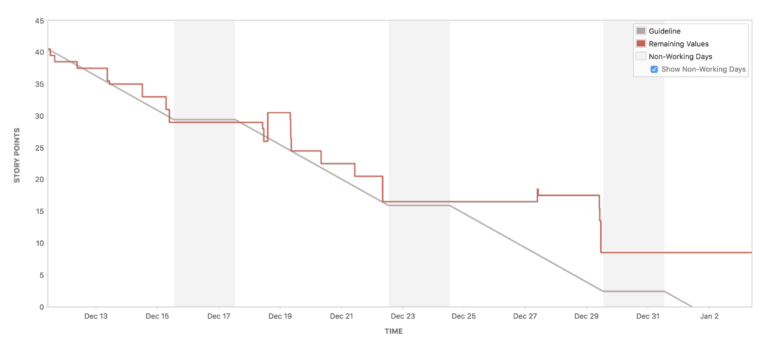
The Burndown Chart is a visual representation showing the amount of work remaining in a sprint or project over time. This chart offers a clear visual of how the team’s performance aligns with planned expectations, helping identify if the team is lagging or ahead of schedule.
Personal Insights:
The Burndown Chart serves as an excellent tool for real-time sprint tracking, providing immediate visibility into the team’s progress against the sprint goal. It’s a straightforward method to visually communicate the sprint’s advancement and any deviations from the plan.
Implementation in Jira:
Access the Burndown Chart in Jira’s “Reports” section to keep a pulse on sprint progress and adjust strategies as needed.
4. Cycle Time and Lead Time
Overview of KPI:
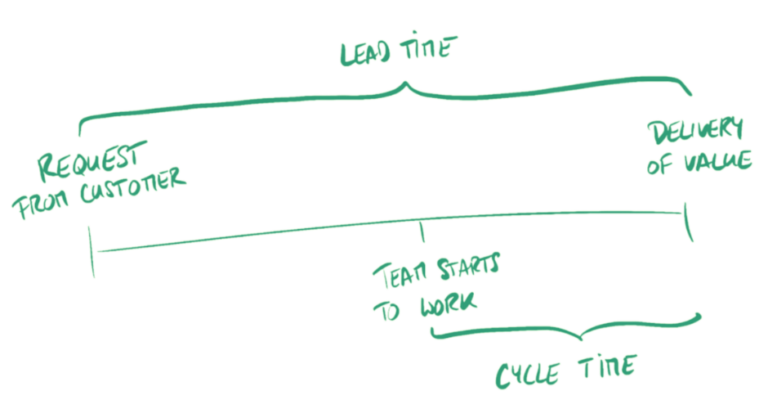
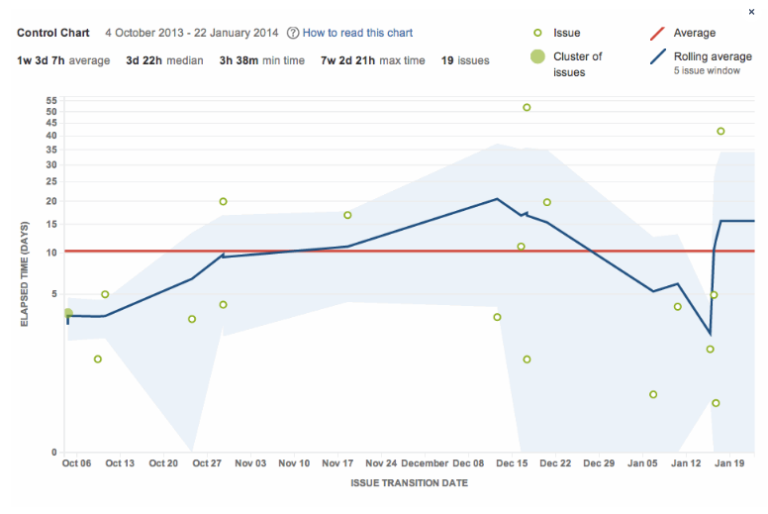
Cycle Time is a crucial measure capturing the total duration a task spends transitioning from “In Progress” to “Done”. This metric encompasses both the active work phase and any periods of waiting, offering a comprehensive snapshot of the task’s journey through the workflow. A more abbreviated Cycle Time suggests a high degree of workflow efficiency and fluidity, indicating a streamlined process free of significant delays. Conversely, an extended Cycle Time can highlight workflow bottlenecks or inefficiencies needing resolution.
It’s important to differentiate Cycle Time from Lead Time, another vital KPI within the Agile toolkit. Lead Time gauges the total duration required for a task to traverse the entire process — from its inception (the moment the task enters the backlog or is requested by a customer) to its final completion. Essentially, while Lead Time measures the task’s lifecycle from request to delivery, Cycle Time focuses solely on the active development phase, from the commencement of work to its conclusion.
Personal Insights:
Understanding and analyzing both Cycle Time and Lead Time has been instrumental in refining our workflow’s efficiency. These KPIs serve as barometers for our process’s health, enabling us to pinpoint slowdown areas and streamline task progression. Especially, Cycle Time has provided us invaluable insights into the effectiveness of our workflow, helping us identify and mitigate process bottlenecks.
Implementation in Jira:
Jira’s Control Chart feature is a powerful tool for monitoring both Cycle Time and Lead Time, offering detailed insights into each task’s journey through the development process. For those looking to dive deeper into implementing these KPIs within their team’s operational framework, Atlassian provides a comprehensive guide titled “3 tools to analyze Cycle and Lead Time in Jira”, which is an invaluable resource for Scrum Masters aiming to enhance project management through precise metric tracking.
5. Burnup Chart
Overview of KPI:
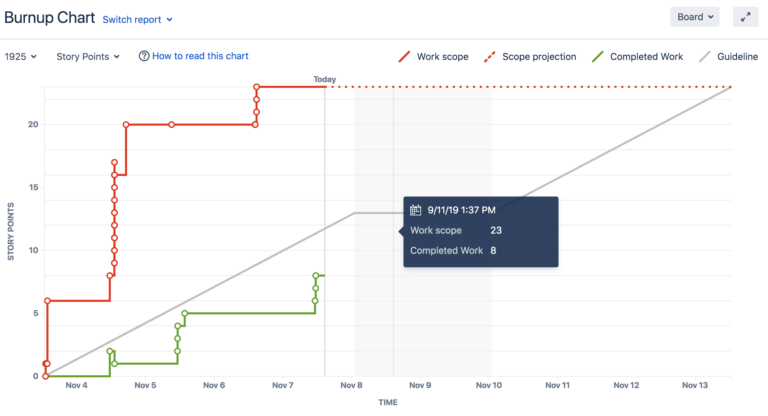
The Burnup Chart illustrates the total work completed in relation to the project’s scope. It showcases the accumulated work done against the total work scope, offering a visual representation of project progress and the team’s pace.
Personal Insights:
The Burnup Chart is an invaluable asset for tracking overall project progression. However, it’s most effective when used in conjunction with other KPIs to offer a rounded perspective on project health and team performance.
Implementation in Jira:
Find the Burnup Chart within the “Reports” section of your Jira project to visualize and track project progress comprehensively.
Conclusion
Adopting Agile and Scrum frameworks enhances project management flexibility and efficiency, essential for navigating the rapid changes in today’s work environments. However, maximizing the potential of these methodologies requires a thorough understanding of specific Key Performance Indicators (KPIs). The Agile KPIs discussed offer valuable insights into different aspects of team performance, contributing to a holistic view of your Scrum team’s effectiveness.
As a Scrum Master, your role extends beyond facilitating Scrum processes to ensuring your team operates at its peak potential. By implementing these five essential Agile KPIs, you can pinpoint areas for improvement, monitor progress, and guide your team towards higher productivity and success. These KPIs, when applied thoughtfully, can transform your team’s approach to Agile projects, fostering a culture of continuous improvement and excellence.
To further support your journey, explore additional resources such as our Jira tutorial for beginners and Atlassian’s insights on Scrum KPIs. These tools and knowledge resources will deepen your understanding of KPIs and enhance your team’s Agile practices.
Leverage these KPIs to unlock your Scrum team’s full potential, driving towards achieving your project goals with enhanced clarity, efficiency, and effectiveness.
Additional Ressources
- Beginners can benefit from our Jira tutorial.
- Learn more about Scrum KPIs on Jira through Atlassian’s guide on Agile metrics.
Dive deeper into maximizing Jira’s potential with this book: “Jira 8 Essentials – Sixth Edition: Effective project tracking and issue management with enhanced Jira 8.21 and Data Center features” By Patrick Li.


